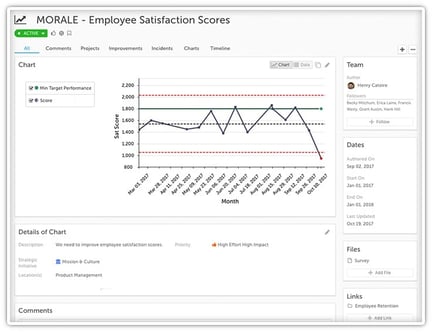
Get your data out in the open where everyone can see it. Nobody likes hunting for data on a shared drive. KaiNexus keeps all of your data in one place, so your whole team knows where to find it.
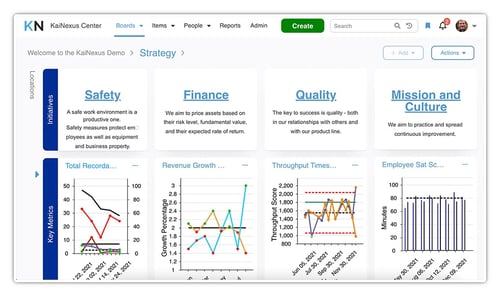
Update your charts in one place and know that they've updated automatically everywhere else. Ensure that everyone from frontline staff to executives has the most up-to-date information across every board, on every screen, in every location.
Draw parallels between improvements and KPIs by giving context to your data points using linked items and notes in chart annotations.
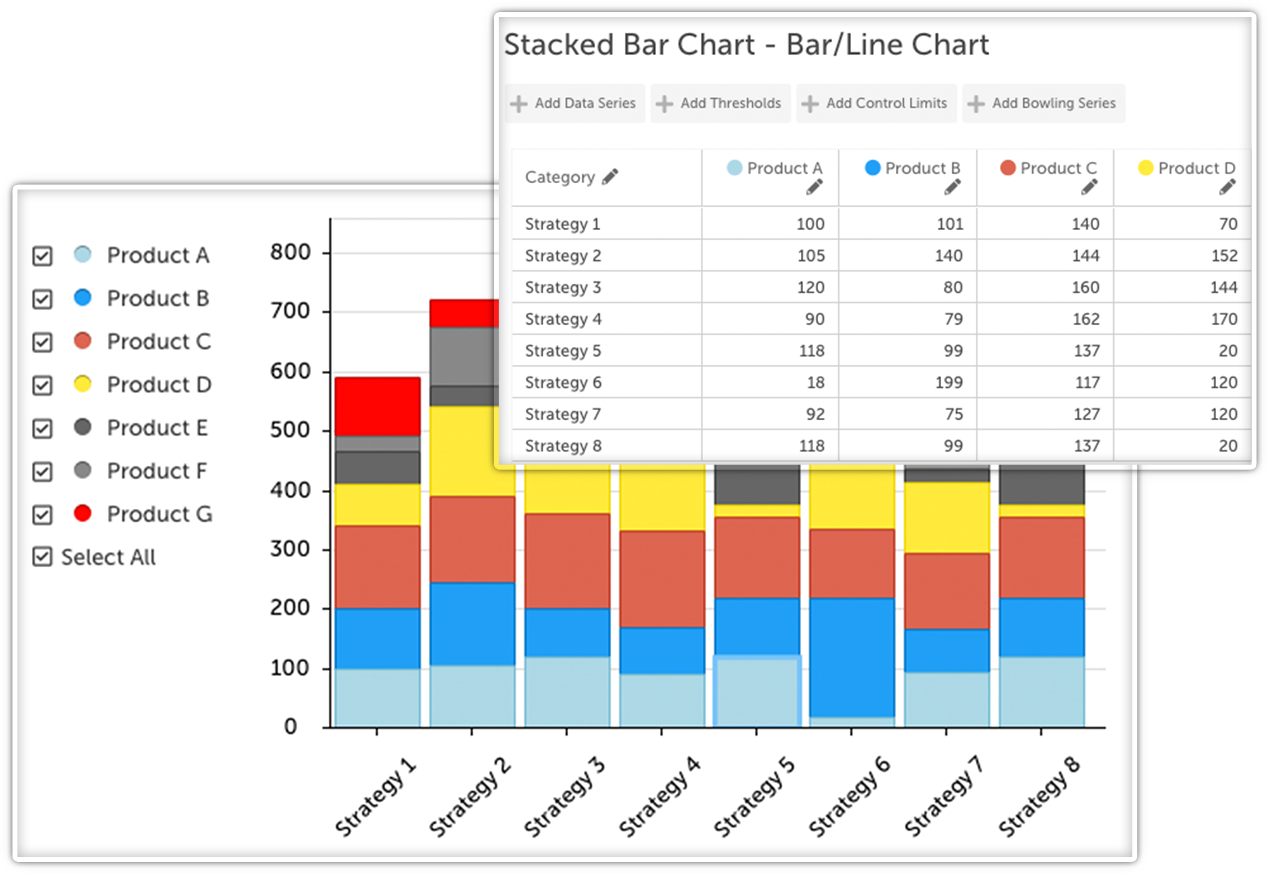
Your staff won't need any training before getting started with KaiNexus' charts, thanks to the familiar spreadsheet interface. You have the option to manually enter your data, or upload existing data from JSON and Excel spreadsheets.
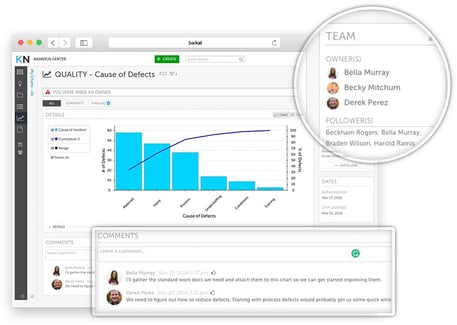
Data shouldn't sit in a shared file hoping people remember to update it. KaiNexus makes it possible to build a team around your KPIs, share relevant files, and communicate with each other all in one spot. Smart notifications keep everyone in the loop, so your teams stay on track.
Build line charts, bar charts, or any combination of the two. Customize your charts to reflect the unique needs of your organization. Whether you need control charts, bowling charts, Pareto charts, or anything in between, KaiNexus has you covered.
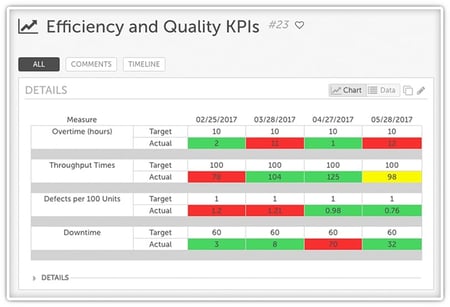
Add charts to your digital boards to track KPIs in real time across your organization. Stop updating your boards one by one - KaiNexus has a better way.
Set upper and lower limits for any data set in control charts, and get automated notifications when your data falls out of control. KaiNexus helps you stay on top of at-risk metrics between meetings so you can respond quickly to problems. See how your data has changed over time by reviewing past versions of your charts.
Copyright © 2025
Privacy Policy